Design Theme
Suggestions:
- Color Palette: Use a blend of “Tech” colors (deep
blues, bright cyan/teal) and “Sustainability” colors (leafy
greens, clean whites).
- Imagery: Combine high-tech imagery (circuit board
patterns, data streams, network nodes) with organic imagery (fresh
produce, clean farm environments).
- Fonts: Clean, modern sans-serif fonts (e.g., Montserrat,
Open Sans, or Roboto).
Slide 1: Title Slide
Layout: A striking, high-impact opening slide.
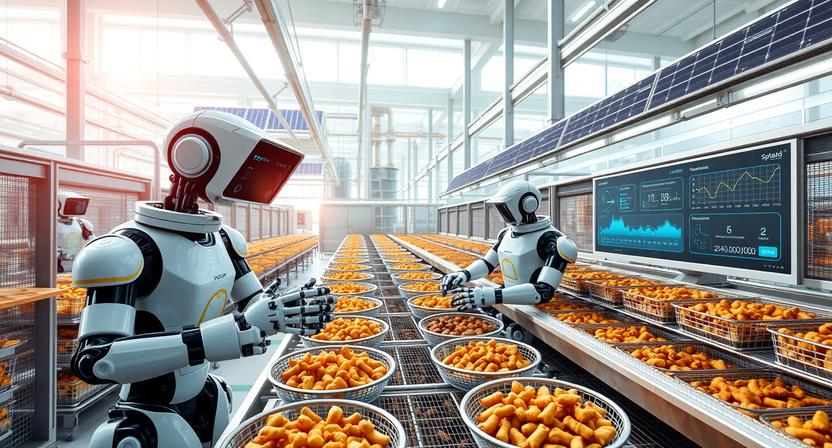
Visuals: A split background or overlay. One half features a
high-tech abstract data network or circuit board pattern in blue; the other
half shows fresh, vibrant food produce (e.g., vegetables on a conveyor belt) in
green. A subtle glowing line connects the two.
Text:
- Title (Large, Bold): AI-Driven Sustainable Food Processing System
- Subtitle: Leveraging IoT, AI, and Automation for Efficient
and Eco-Friendly Food Production
- Footer: David Assomull | 1/29/2026
Slide 2: Introduction
Layout: Problem/Solution structure. Split the
slide vertically or horizontally.
Visuals:
- Left Side (The Challenge): Icons of an upward trend arrow (growing demand),
a strained gear (challenges), and a trash bin (waste). Use warmer/alert
colors like orange/red.
- Right Side (The Solution): A prominent arrow pointing to icons of a brain
chip (AI), a sensor node (IoT), and a robotic arm (Automation). Use cool
blues and greens.
Text:
- Heading: The Challenge & The Solution
- (Left) The Pressing Need:
- Growing global demand for
sustainable food.
- Critical
challenges in quality control, resource scarcity, and operational
efficiency.
- (Right)
The Integrated Approach:
- Solution:
Converging AI, IoT, and Automation technologies to revolutionize the
process.
Slide 3: System
Overview
Layout: A central hub diagram.
Visuals: A central circle labeled “AI-Driven Sustainable
System.” Three arrows point outwards to three surrounding circles.
- Circle 1 (Top): “Real-time Monitoring” (Icon: Eye with
data stream)
- Circle 2 (Bottom Left): “Intelligent Decision-Making” (Icon:
Brain with gears)
- Circle 3 (Bottom Right): “Sustainability Goals” (Icon: Leaf with
recycle arrow)
Text:
- Heading: Holistic System Overview
- Body: synergetic combination of IoT sensors, advanced
AI models, and precise control systems designed for:
- Energy Efficiency
- Uncompromising Quality
Assurance
- Significant
Waste Reduction
Slide 4: Key
Components
Layout: A clean 2×3 grid of icon-based tiles.
This serves as a visual table of contents.
Visuals: Six distinct tiles with large, clean icons.
Text:
- Heading: Core System Pillars
- Row 1:
- [Icon: Sensor Chip] IoT
Sensors & Hardware
- [Icon: Camera Lens] Imaging
& Inspection Systems
- [Icon:
Cloud Server] Cloud & Data Storage
- Row
2:
- [Icon: Neural Network] AI
& Machine Learning Frameworks
- [Icon: Robotic
Arm/Gears] Control & Automation Systems
- [Icon:
Dashboard Screen] User Interface & Visualization
Slide 5: IoT Sensors & Hardware
Layout: Text on the left, technical diagram on
the right.
Visuals (Right): A schematic diagram. Show environmental icons
(thermometer, water drop, sun, vibrating motor) connected by lines to central
microcontroller icons (labeled Raspberry Pi / Arduino). Arrows show data
flowing from controllers towards a “Gateway” icon.
Text (Left):
- Heading: The “Nervous System”: IoT Sensors
- Environmental Sensing:
- Temperature (DS18B20) &
Humidity (DHT22/SHT31) for climate control.
- Solar
irradiance sensors for energy management.
- Machine Health:
- Vibration
sensors for predictive maintenance.
- Edge
Processing:
- Microcontrollers:
Raspberry Pi 4, Arduino for local data collection.
Slide 6: Imaging &
Inspection
Layout: Text on the left,
“Before/After” visual examples on the right.
Visuals (Right):
- Top Image: A photo of a camera setup mounted over a conveyor
belt lit by an LED ring light.
- Bottom Images: Two side-by-side images of produce (e.g.,
apples).
- Left: “Raw Input” shows an apple with a
bruise.
- Right: “AI Output” shows the same apple with
a red bounding box around the bruise and a label “Defect Detected:
98% Confidence.”
Text (Left):
- Heading: Automated “Eyes” on the Line
- Hardware Setup:
- High-resolution cameras (e.g.,
RPi Camera Module V2).
- Consistent,
shadow-free illumination using LED ring lights.
- Function:
- Automated,
high-speed visual defect detection, replacing manual inspection.
Slide 7: Data
Management & Cloud Integration
Layout: A flow chart diagram spanning the slide
from left to right.
Visuals:
- [Icon: Edge Devices/Sensors]
-> Arrow labeled “MQTT / REST APIs” -> [Icon: Cloud Icon
(labeled AWS IoT)] -> Three branching arrows leading to:
1.
[Icon: Database
Cylinder (labeled DynamoDB – Hot Data)]
2.
[Icon: Storage Bucket
(labeled S3 – Cold Storage)]
3.
[Icon: Server Rack
(labeled Local Backup Server)]
Text:
Heading: Robust Data Architecture
Ingestion: Secure data streaming via efficient
protocols (MQTT).
Cloud
Platform (AWS): Scalable storage
(S3) and real-time databases (DynamoDB).
Resilience: Local servers ensure continuous
operation during connectivity loss.
Slide 8: AI &
Machine Learning
Layout: Text bullet points on the left, a
simplified neural network diagram on the right.
Visuals (Right): A diagram showing layers. An “Input
Layer” (image icon) connected by lines to several “Hidden
Layers” (labeled CNN / Feature Extraction), finally connecting to an
“Output Layer” showing two nodes labeled “Pass” (Green) and
“Fail” (Red).
Text (Left):
- Heading: The “Brain”: AI & Deep Learning
- Models: Utilization of Convolutional Neural Networks
(CNNs) like ResNet and MobileNet for image analysis.
- Primary Tasks:
- Real-time image classification
and defect detection.
- Predictive
analytics to optimize process parameters before issues occur.
- Toolstack: TensorFlow, Keras, scikit-learn.
Slide 9: Control &
Automation
Layout: A circular feedback loop diagram.
Visuals:
- Top: [Icon: AI Decision Block]
-> Arrow -> Right: [Icon: PLC Controller (Siemens/Allen-Bradley)]
-> Arrow -> Bottom: [Icon: Actuators (Motors/Relays)] labeled “Process
Adjustment” -> Arrow -> Left: [Icon: Sensors] labeled “New
Data” -> Arrow looping back to Top AI Block.
Text:
- Heading: Closing the Loop: Automated Control
- Industrial Controllers: PLCs (Siemens S7-1200, Allen-Bradley) execute
commands.
- Actionable Output: Actuators (servos, relays) physically adjust
temperature, speed, or sorting mechanisms.
- Integration: Automated adjustments based instantly on AI
output via MQTT/REST.
Slide 10: User
Interface & Monitoring
Layout: A large, clean mockup of a dashboard
screen.
Visuals: A stylized screenshot of a tablet or desktop monitor.
- Top banner: System Status: OPTIMAL (Green indicator).
- Main body: Three panels.
1.
A line graph showing
“Energy Consumption vs. Output.”
- Gauges
showing current “Temp” and “Humidity.”
-
- A
list titled “Recent Alerts” with one entry: “[10:45 AM]
Defect Rate Spike on Line 2 – Auto-Adjusted.”
Text:
- Heading: Real-Time Visibility & Control
- Centralized Dashboards: Built on Grafana or Power BI for at-a-glance
insights.
- Remote Access: Web applications allow monitoring and control
from anywhere.
- Actionable
Insights: Instant visualization of
process status, trends, and critical alerts.
Slide 11: Benefits
& Impact
Layout: Four vertical columns, each with a large
icon at the top and emphasize sustainability using green accents.
Visuals:
- Col 1 Icon: Badge with a checkmark.
- Col 2 Icon: Down arrow inside a leaf.
- Col 3 Icon: Magnifying glass over a waveform.
- Col 4 Icon: Upward trending arrow with a dollar sign/globe.
Text:
- Heading: Delivering Tangible Value
- Column 1: Quality
- Improved
Consistency: Ensuring uniform,
high-quality products.
- Column 2: Efficiency
- Resource
Savings: Significant reduction in
energy and water consumption.
- Column 3: Proactive
- Early
Detection: Identifying anomalies
before they become costly failures.
- Column
4: The Bottom Line
- Enhanced
Sustainability: Boosting profitability
while meeting eco-goals.
Slide 12: Future
Directions
Layout: A timeline or roadmap style with an
arrow pointing forward.
Visuals: A horizontal arrow segmented into four steps, moving from
left to right.
- Step 1 Icon: Chain links block (Blockchain).
- Step 2 Icon: Robot arm holding a product (Advanced Robotics).
- Step 3 Icon: Calendar with a wrench (Predictive Maintenance).
- Step 4 Icon: Factory building with different food icons
(Expansion).
Text:
- Heading: The Road Ahead
- Step 1: Blockchain integration for end-to-end supply
chain traceability.
- Step 2: Advanced robotics for fully autonomous handling
and packaging.
- Step 3: AI-driven predictive maintenance to eliminate
unplanned downtime.
- Step
4: Expansion into other
sectors (e.g., dairy, beverages, meat processing).
Slide 13: Conclusion
Layout: Similar to the title slide, but focused
on the positive outcome. A bright, clean, aspirational image.
Visuals: An image of a modern, clean food processing facility with
abundant natural light, or a close-up of perfectly processed, healthy food.
Text:
- Heading: Revolutionizing Food Production
- Summary: This integrated AI-driven system is not just an
upgrade; it is a necessary evolution for the industry.
- Impact: Unlocking unprecedented levels of efficiency,
quality, and environmental responsibility.
- Call
to Action (Bold): Adopt
innovative technologies today for a sustainable food future tomorrow.
Slide 14: Questions
& Discussion
Layout: Simple, clean, and inviting.
Visuals: A large, stylized question mark icon in the center,
perhaps made of connecting dots/nodes.
Text:
- Heading: Questions & Discussion
- David Assomull
- Admin. Director
- jessyjayagroalliedltd@gmail.com
- [LinkedIn
Profile / Website URL]