Welcome to BSME2E
Live

JESSY JAY INTERNATIONAL NIGERIA LIMITED (JJIL)
Material Flow Overview
1. Introduction &
Reporting Period
·
Reporting Period: January 2023 – December
2023Baseline Year: 2022 (for comparison and trend analysis)
·
Our material flow overview maps the journey of
key inputs, outputs, and waste streams within our dehydration and food
processing operations, emphasizing circularity, resource efficiency, and
environmental impact.
2. Procurement
Sources & Material Entry Points
Key Inputs
·
Agricultural
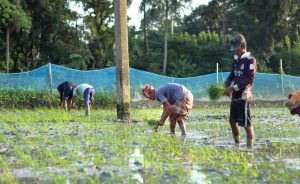
Residues & Biomass: Sourced locally from farmers and cooperatives in
Nigeria, Ghana, and Kenya.
·
Packaging
Materials: Recycled and recyclable plastics, paper, and biodegradable
options sourced from certified suppliers.
·
Water
& Energy: Recovered and reused within the process; renewable solar
energy supplement.
Entry Points
·
Raw biomass and agricultural waste are collected
at farm sites and transported to processing facilities.
·
Packaging materials are delivered periodically
based on production schedules.
·
Water is sourced from local municipal or
borehole supplies, with recycling systems in place.
3. Material Flow
& Circularity Metrics
In-Flow Metrics
|
Material Type |
Quantity (tons) |
Source |
Circular Inflow % |
Reporting Period |
Baseline (%) (2022) |
|
Agricultural Residues |
500 |
Local farms |
100% |
2023 |
80% |
|
Recycled Packaging |
20 |
Certified recyclers |
100% |
2023 |
N/A |
|
Water (reused) |
200,000 liters |
Recycled within plant |
60% |
2023 |
30% |
Out-Flow & Waste
Streams
|
Waste Type |
Quantity (tons) |
End-of-Life Pathway |
Circular Outflow % |
Reporting Period |
Baseline (%) |
|
Organic Waste (spent biomass, peelings) |
150 |
Composting, animal feed |
70% |
2023 |
40% |
|
Packaging Waste |
5 |
Recycling partnerships |
80% |
2023 |
50% |
|
Process Water |
100,000 liters |
Reused/recycled |
60% |
2023 |
30% |
|
Non-recyclable Waste |
20 |
Landfill |
20% |
2023 |
50% |
Key Circular Metrics
·
Waste
Diversion Rate: 70% of organic waste diverted from landfills.
·
Recycled
Input Rate: 100% of packaging materials recycled or biodegradable.
·
Material
Recovery Rate: 65% of process water recovered and reused.
·
Greenhouse
Gas Reduction: Estimated reduction of 1,200 tons CO₂e annually, primarily
from biomass fuel substitution and reduced waste sent to landfills.
4. Chemical Safety
& Standards
·
All chemicals used in cleaning and maintenance
are compliant with Globally Harmonized System (GHS) standards.
·
Use of biodegradable and non-toxic cleaning
agents.
·
Regular chemical safety audits and training.
·
Substitution of hazardous chemicals with safer
alternatives where possible.
5. End-of-Life
Pathways
·
Product
Recycling: Dehydrated food packaging is designed for recyclability;
partnerships established with local recyclers.
·
Take-Back
Schemes: Pilot programs with local farmers and cooperatives to return used
packaging for recycling.
·
Composting
& Organic Waste: Organic residues processed into compost or animal
feed, closing the nutrient loop.
·
Refurbishment
& Reuse: Equipment designed for durability; parts are repaired or
replaced to extend lifespan.
6. Visual Diagram
(Optional)
A flow diagram can
illustrate:
·
Inputs entering the system (biomass, packaging,
water).
Processing stages
·
Outputs (dehydrated products, biomass ash,
recovered water).
·
Waste streams diverted to recycling, composting,
or landfills.
·
End-of-life pathways for packaging and organic
waste.